For Emergency BLOOD requirement in any city in India, SMS to 5676775
"Blood <
s p a c e > PIN code of your city < s p a c e > required blood group < s p a c e > your name"

Friday, 28 September 2007

Stocks in FnO

Following is a list of top gainers and losers in the futures and options market in the NSE on the 27 Sep 2007 for the October series:

Top Gainers


% Change
Symbol
Open High Low Close in OI
RAJESHEXPO 929.8 963.5 915.1 931.8 980.95
SHREECEM 1476.6 1495 1450 1464.65 568.75
PURVA 437.2 442 422.1 435.5 336.84
TRIVENI 122.4 123.4 106.8 109.85 315.13
J&KBANK 739.8 771 730.35 757.7 280.85
HDIL 635 636 610.1 612.95 181.7
MATRIXLABS 239 239 230.4 232.6 165.64
NUCLEUS 344.9 347 312.05 330.8 161.5
ABIRLANUVO 1494 1510 1451 1462.25 152.22

There are no top losers as this is the last day of the previous expiry and the current month have just started setting up positions and hence buying. ........................... Click here to read more!

Nifty expiry day for the last 9 months

September 2007
August 2007
July 2007
June 2007
May 2007
April 2007
March 2007
February 2007
January 2007
The nine months nifty expiry can be viewed here. Interesting to note is that the current September expiry did fail to bring any results unlike the rest 8 months depicted. It is not a hard and fast rule but the fellows wanted to bring peace all across and hence did not move or spike for last hour gains. Since there was huge activity around 5000 puts and calls, the nifty went bang at this level killing all those who took or long on this strike price.
........................... Click here to read more!

Monday, 24 September 2007

Nifty intra day movement for 24 September


Nifty intra day for 24 September 2007 shows one break and the second supporting as of now ..... Generally it has been seen that if a third one is created and it breaks down, a little fall is expected. Keep nifty longs if you have taken intra at the lows ....and keep riding them ......and hope for the best. ........................... Click here to read more!

Stocks in FnO

Following is a list of top gainers and losers in the futures and options market in the NSE on the 21 Sep 2007 for the September series:

Top Gainers


% Change
Symbol Open High Low Close in OI
MAHSEAMLES 611 620.7 601 614.15 28.39
JINDALSTEL 4929 5728 4929 5427.55 18.42
NTPC 187.6 189.75 182.7 186.85 6.38
INDIANB 158 161.9 158 160.05 5.33
SASKEN 353 357.65 338.3 343.65 5.3
TRIVENI 131.3 133.95 114.75 122.55 5.03
CUMMINSIND 411.5 429 407.2 423.25 4.59


Top Losers


% Change
Symbol Open High Low Close in OI
ABAN 3340 3419 3335 3351.4 -31.83
IFCI 80.6 84.25 80.1 82.7 -28.98
SATYAMCOMP 419.9 424 405.1 421.05 -26.53
IVRPRIME 419.9 427.7 414 425.15 -22.92
LT 2752 2817 2744 2789.75 -22.74
INFOSYSTCH 1790 1842.7 1758 1827.15 -21.61
NEYVELILIG 102.7 103.25 99.5 100.3 -21.4
GTL 242.9 244.9 239.95 241.15 -21.16
ROLTA 494 536.4 494 524.6 -20.86
BHARTIARTL 893 931 893 924.15 -19.89
TTML 34.2 37.25 34.2 36.2 -19.51
BANKBARODA 312 319 306.55 312.55 -19.42
WIPRO 433 445 425.35 442.2 -19.35
PNB 508 520 508 517.35 -18.94
WELGUJ 290.2 295.8 276.5 282.15 -18.75
IVRCLINFRA 413.8 422 411.05 416.75 -17.41
HCC 141.8 146.6 141.8 144 -17.14
CESC 510 516.5 501.1 506.85 -16.6
BAJAJHIND 173 182.35 171.65 176.3 -15.85
REL 991 1033 989.7 1005.55 -15.47
BONGAIREFN 58.15 62.4 58.1 60.3 -15.36
PURVA 423 447.9 423 444.55 -15.29
........................... Click here to read more!

Sunday, 23 September 2007

Pivot Points

Pivot point calculations are used by security traders to attempt to predict support and resistance levels which are, in turn, used as visual cues to execute trades. These calculations provide traders with objective visual bench marks which some use to predict price changes. They are commonly used in the forex and commodity futures markets. Pivot point analysis is a subset of technical analysis, although it is not as popular or well known as other technical methods.

Some traders believe that there are two prevailing tendencies in price movements. If a day's price action begins above the pivot point, prices will tend to stay above that point (fulcrum) until it reaches a resistance point. Conversely, if a day's price action begins below the pivot point, the price will tend to stay below that point until it reaches a support point. A resistance level is a price that tends to prevent further upward movement. A support price is a price action point that tends to prevent further downward movement.

Typically such a trader, when price approaches a pivot above, waits for a reversal at that point and sells. The opposite is true when price action is moving downward, the pivot trader waits for a bounce off the pivot of support and places an order to buy.

The rationale of this is an attempt to avoid buying high (at R2) or selling at the low (S2).

This strategy may not be supported by most technical watchers but is amongst one that is in some use.


Pivots are used to project potential support and resistance levels. The main time periods used are daily, weekly, and monthly pivots. The formula for the daily pivot point, support, and resistance is shown below:
  • Pivot Point = [Yesterday's High + Yesterday's Low + Yesterday's Close] / 3

Support Levels

  • S1 = [Pivot Point * 2] - Yesterday's High
  • S2 = Pivot Point - Yesterday's High + Yesterday's Low
  • S3 = S2 - Yesterday's High + Yesterday's Low

Resistance Levels

  • R1 = [Pivot Point * 2] - Yesterday's Low
  • R2 = Pivot Point + Yesterday's High - Yesterday's Low
  • R3 = R2 + Yesterday's High - Yesterday's Low

To calculate weekly or monthly numbers, simply replace "yesterday's" with "last week's" or "last month's" high or low.

A 5-minute chart and the corresponding pivots are shown below:

In the chart above, and going from left to right, Resistance Level 1 (R1) held and the price reversed course and headed downward.

After that, the next potential support was at the Pivot Point. However, the price broke through the Pivot Point. Notice that when the stock attempted to reverse course, it was rejected by the Pivot Point now acting as resistance. An important technical analysis concept is that when resistance is penetrated the prior resistance then becomes support. Similarly, when support is penetrated the prior support then becomes resistance.

From there, the next support was Support Level 1 (S1). S1 held strong and the stock reversed direction yet again.

The next resistance line was at the Pivot Point, which failed.

The trading day ended by the stock testing the Pivot Point, now acting as support, which subsequently held. From there, the index rallied on into the close.


In addition to giving buy and sell signals, Pivots give traders a good time to get out of their trade. To illustrate, during a rally some traders will set their sell orders right below the next resistance line. Thus, pivot point resistance and support lines can generate ready made profit targets.

In the 5-minute chart of another example, the stock opened the day downward, but held steady at Support 2 (S2).

From there, the price rallied past S1 and the Pivot Point. Eventually, the price found resistance at Resistance 1 (R1).

Next, the Pivot Point offered support initially, but then the stock meandered slightly above and below the pivot point, until finally, the stock accelerated past R1 and then past R2.

The rally continued until one candlestick reached R3, where the bulls were promptly rejected.

........................... Click here to read more!

Friday, 21 September 2007

Stocks in FnO

Following is a list of top gainers and losers in the futures and options market in the NSE on the 20 Sep 2007 for the September series:

Top Gainers
Symbol Open High Low Close % Change in OI
3IINFOTECH 150.85 154.9 149.1 150.6 52.18
LITL 376.65 380.7 332.05 340.65 30.11
TRIVENI 138 143.8 128.3 131.4 25.53
TVSMOTOR 71.3 75.95 70.5 73.5 22.98
CHENNPETRO 273.1 278.7 267 270.2 18.88
NIITTECH 360 364 341.1 343.45 16.82
BIOCON 453 475 448 467.2 13.86
APIL 814.4 826.8 803 808.15 11.31


Top Losers
Symbol Open High Low Close % Change in OI
GTL 243 244.75 240.95 241.6 -38.21
UNITECH 296.9 336.9 292.1 330.5 -31.14
ROLTA 480 499.7 476 493.9 -26.8
BHARATFORG 282.5 297 282.5 292.6 -24.87
PURVA 422 443.1 413.2 424.8 -22.47
SKUMARSYNF 117.8 118 115.4 116.15 -21.15
SUNPHARMA 1019 1019.5 989 992.35 -19.14
ORIENTBANK 234.55 238 232.5 233.85 -17.91
IVRCLINFRA 408.9 419.7 406 411.25 -16.36
EDUCOMP 3070.1 3090 3008 3028.9 -15.71
SATYAMCOMP 432 432.8 420.6 422.8 -15.25
KTKBANK 218.15 230.3 218 225.65 -14.76
BAJAJHIND 178 184.3 171 173.2 -14.6
ULTRACEMCO 1018 1029 1006 1021.15 -14.14
ABB 1280 1303 1255.05 1284.4 -13.79
JSWSTEEL 720 725 710 719.55 -13.51
HCLTECH 284.55 284.55 275.05 277.3 -12.49
BIRLAJUTE 321.95 334 317.5 323.55 -12.26
PNB 515.95 517 508.25 510.1 -11.99
BOMDYEING 680 713.5 668 702.55 -11.64
SOBHA 806 837.9 800 826.75 -10.64
INDUSINDBK 73.2 81.15 72.5 78.15 -10.58
KOTAKBANK 844 865.65 835.25 851.45 -10.56
INDIACEM 286 291.15 282.95 286.35 -10.5
HDFCBANK 1335 1335 1311 1323 -10.41
RENUKA 699.7 731.95 681.1 691 -10.15
J&KBANK 704 708 697.55 702.55 -10.12
........................... Click here to read more!

Wednesday, 19 September 2007

Stocks in FnO

Following is a list of top gainers and losers in the futures and options market in the NSE on the 18 Sep 2007 for the September series:

Top Gainers
Symbol Open High Low Close % Change in OI
CORPBANK 372.3 384.05 366 380.1 23.44
INDIAINFO 832.5 874.9 832.5 840.3 20.4
INDUSINDBK 64.7 74.65 64 73.45 15.5
CAIRN 162 165.7 161.6 163.35 15
EKC 226.1 232 226.1 227.75 13.74
EDUCOMP 2880 2946.65 2853 2920.15 13.35
YESBANK 181 188.75 179.5 185.5 12.03
TECHM 1305 1329.85 1288.8 1302.4 11.72
RELCAPITAL 1382.3 1464 1382 1454.45 10.97
IOB 136.05 140.7 136 139.65 10.51
MOSERBAER 303.3 310.3 303.3 305 10.32


Top Losers
Symbol Open High Low Close % Change in OI
NEYVELILIG 98.45 99.45 96.15 96.6 -22.28
SKUMARSYNF 111.6 114.8 110.8 114.1 -16.92
JINDALSTEL 4632 4695 4624.85 4676.45 -16.02
UNIONBANK 144.8 147.35 142.5 146.15 -14.94
TATACHEM 255.9 263.5 255.2 259.95 -13.04
BILT 145.4 146.4 143 143.6 -12.6
TATAPOWER 733 749.9 733 746.05 -12.6
ANDHRABANK 91 94 90.8 93.65 -12.28
BANKBARODA 283 299 282 297.6 -12.01
ESCORTS 103.5 109.9 103.5 109.45 -10.44
WOCKPHARMA 403 409 403 405.15 -10.29
........................... Click here to read more!

Trading Dow Jones on the rate cut day

Trading Dow Jones is an art for most traders. Amongst the many strategies, this is one of those that really worked. The timing of the announcement was known to all before hand. Around 1140 p.m. India time, the Dow Jones was hovering at 13475. The next five minutes were to spill the beans. So what we would have suggested was to place in the system a buy and a sell order. Buy order at 50 points over this value at 13525 and a sell order at 50 points below this value at 13425. Why did we take that 50 away margin? Simply to avoid a whipsaw. For punters are a great lot who try to do unusual things. And if you happen to have noticed later on, at 1145 p.m. India time, Dow started rising from a low value of 13467 and shot up to a maximum of 13584 that very minute. The sell order thus was not executed. The buy order was executed at 13525 enabling one to gain 50 points in the first minute itself. It rose on still further. Exit points which could practically have been can be seen depicted on the chart. A neat profit of 100 to 200 points till the close of the day is what one could have got if this strategy was used on Tuesday Dow market.
........................... Click here to read more!

Monday, 17 September 2007

Stocks in FnO

Following is a list of top gainers and losers in the futures and options market in the NSE on the 14 Sep 2007 for the September series:

Top Gainers
Symbol Open High Low Close % Change in OI
NUCLEUS 364.9 368 337 338.35 179.04
SASKEN 359.7 378.85 337.55 341.75 49.69
BHUSANSTL 913 974.35 913 939.55 43.46
ROLTA 478.4 479.9 446.5 449 31.25
BANKINDIA 254.5 256.5 241.2 243.1 26.85
PURVA 370 389.8 367.1 377.4 24.52
3IINFOTECH 144.8 147.5 137.25 138.15 22.44
PUNJLLOYD 301.9 304.2 291.6 293.35 21.18
CROMPGREAV 319 321 307.15 309.2 20.14
ARVINDMILL 54.9 55.3 51.95 52.6 13.36
NICOLASPIR 280.4 284.7 276.55 279.8 12.06
TECHM 1332.5 1339 1289 1302.35 11.69
IDFC 137.5 138.5 129.55 131.3 10.59
PATELENG 447 467.5 447 454.5 10.56


Top Losers
Symbol Open High Low Close % Change in OI
KTKBANK 206.1 213.95 204.35 209.8 -19.48
BEML 1266.9 1286.7 1223.2 1233.7 -18.76
INDIAINFO 770.05 847.9 770.05 839.65 -17.88
ANSALINFRA 254.9 266.7 253.65 260.4 -16.91
GESCOCORP 575 603 568 581.6 -14.25
CORPBANK 362 374.8 361.1 367.85 -13.43
UNIPHOS 364.95 368.7 350.65 353.25 -13.33
RELCAPITAL 1417.7 1434.5 1382 1389.75 -13
BONGAIREFN 61 61.2 57.55 57.9 -11.24
KOTAKBANK 784 794.2 769.4 773.8 -10.45
........................... Click here to read more!

Sunday, 16 September 2007

The Fed follows the Market

This is an interesting piece of graph depicted at the following web link which was passed on the chat : http://www.elliottwave.com/features/default.aspx?cat=mw*aid=3336*time=pm
It is interesting to note how the decision makers lag the markets and not create the waves. What happens on the 18th is something for the records. What all effects shall take place immediately and subsequently is to be analyzed.
........................... Click here to read more!
Friday, 14 September 2007

Indowind - a new listing


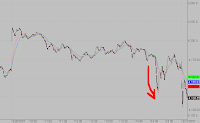
Indowind is a new stock which got listed at the stock exchanges today. A 65 rupee issue price went bang on in a single session just missing from getting doubled. It has been seen that most of these low priced stocks are subjected to heavy punter activity during in initial days. But the mood of the market has to be right for that too. Today was one perfect day for this lucky stock. Any one who traded long in the stock must have made money.
Refer to the image above and see that chart shows two major setups which if one could easily have recognized could have made beautiful entries for good green in the pocket. These are simple formations which somehow did work well and gave you a good picture. Nothing to admire in it but to make a killing is the essence of the matter. A cup formation breakout and then followed by a parallel channel breakout. The chart has been adjusted to show 5 minute formations though we never went to these formation and just visualized all on tick charts.
Let us pray we get good opportunities like these in the near future too.
This is just a little educative exercise to keep us on toes.
........................... Click here to read more!

Inflation in India

The above image is what is predicted by CITI as to what the inflation is expected to be in our India. We shall stay below 4 only for some time before it starts to rise again to near 5 values sooner or later. GOD bless India ! ........................... Click here to read more!

Stocks in FnO

Following is a list of top gainers and losers in the futures and options market in the NSE on the 13 Sep 2007 for the September series:

Top Gainers
Symbol Open High Low Close % Change in OI
CMC 1038 1087 1036 1038.8 52.17
INDIANB 152.1 154 150 151.5 51.9
TECHM 1290 1350 1284.5 1320.35 46.2
CROMPGREAV 317 326.9 315 316 42.56
NUCLEUS 353 365.85 350 357.9 26.52
APTECHT 372 398.65 372 392.6 22.97
BILT 145.7 147.45 143.2 143.95 22.31
BONGAIREFN 58.4 61.6 58.4 60.95 21.46
PUNJLLOYD 304 306.45 293.5 297.4 20.89
OMAXE 326 338.95 325.5 335.4 20.67
ROLTA 484.45 486.9 466.3 472.15 20.1
3IINFOTECH 144 145 142.5 143 15.67
BIOCON 463.3 475 463.3 465.95 15.26
HCC 138.6 141.45 136 136.85 14.18
MARUTI 864.1 899 856.1 896.4 14.01
UNIPHOS 360.5 371.75 357.65 361.35 13.83
JPHYDRO 53.9 54.65 52.75 53.65 13.76
SCI 200.05 214 197.5 211.6 12.96
YESBANK 185.9 188.45 183.55 184.65 12.59
VIJAYABANK 62.2 62.85 60.7 61.4 12.29
HAVELLS 517 533 517 520.65 11.5
CENTRALBK 140.4 143 139.15 140.15 10.67


Top Losers
Symbol Open High Low Close % Change in OI
TRIVENI 87.9 92.3 87.15 91.1 -31.13
INDIAINFO 728 772.5 727.05 769.7 -15.29
NAGARFERT 46.4 47.3 45.75 46.1 -11.93
ORIENTBANK 231.8 232.8 229.55 230.8 -11.78
AIRDECCAN 144.6 144.65 143 144.1 -11.19
IFCI 78 80 76.4 79.3 -9.89
GESCOCORP 532.3 568.85 532.3 565.35 -9.75
ARVINDMILL 52.45 54.8 52.35 54.2 -9.73
IPCL 400.4 402.9 398.95 401.25 -6.22
JINDALSTEL 4425 4625 4396.2 4572.5 -5.46
IDBI 135.4 137.85 134.3 135 -5.24
........................... Click here to read more!

Thursday, 13 September 2007

Stocks in FnO

Following is a list of top gainers and losers in the futures and options market in the NSE on the 12 Sep 2007 for the September series:

Top Gainers
Symbol Open High Low Close % Change in OI
UNIPHOS 355 374.4 344.2 359.6 177.89
NAGARFERT 44.4 47.4 44.4 46.7 26.05
LAXMIMACH 3170 3200 3129 3150.75 25.04
BATAINDIA 170 181.9 170 179.8 22.09
ANSALINFRA 253.9 258.8 248 249.55 19.34
GNFC 138.65 146.8 137.5 145.4 15.73
TTML 35.3 36 34.45 34.65 14.48
ROLTA 508.4 510.8 481 483.5 14.1
BALRAMCHIN 64 67.45 63.45 65.95 14.06
HCC 135.35 138.7 133 137.6 13.8
ANDHRABANK 94 96.55 92.35 93.95 13.38
TATATEA 792.4 812 792.05 799.25 12.61
SRF 142.6 152 140.6 149.95 12.42
CHAMBLFERT 50.8 53.4 50.3 52.85 11.9
TRIVENI 86.3 89.35 84.5 87.2 11.82
SESAGOA 2084 2178 2080 2144.15 11.76
RENUKA 538.5 566 537.05 556.15 11.59
NIITTECH 359.5 359.75 339.9 344.1 11.28
IOB 142.85 146.2 141.8 143.4 11.07


Top Losers
Symbol Open High Low Close % Change in OI
JPHYDRO 50.5 53.85 49.95 53.2 -23.6
CENTRALBK 137.8 140.3 137.15 139.3 -11.73
HDIL 570 583.8 565.65 574.95 -11.05
LITL 302.4 309 300 302.85 -10.86
MCDOWELL-N 1670 1712.7 1653.7 1690.25 -10.65
........................... Click here to read more!

Wednesday, 12 September 2007

Stocks in FnO

Following is a list of top gainers and losers in the futures and options market in the NSE on the 11 Sep 2007 for the September series:

Top Gainers
Symbol Open High Low Close % Change in OI
UNIPHOS 344 360.3 342.15 347.15 60.22
IOB 131 141.7 130.1 139.85 49.72
SESAGOA 2005 2104 1996 2060.95 39.67
VIJAYABANK 58.1 63.3 57.85 61.75 36.48
NEYVELILIG 85.75 94.2 84.25 93.35 29.28
ROLTA 509 517.8 503.1 504.75 21.84
CUMMINSIND 399.9 403.5 397.5 400.9 18.36
IOC 407.95 416.6 402.1 406.1 17.39
ASHOKLEY 38.9 39.25 37.25 37.7 16.19
CMC 1128 1128 1075 1080.45 15.81
BONGAIREFN 61 61.7 58.75 59.1 15.5
IFCI 75.95 79.2 75.75 78.3 15.32
AIRDECCAN 143.95 146.2 142.65 143.1 13.25
GESHIP 336 343.5 332.5 334.5 11.48
IVRCLINFRA 391.8 396.5 378.2 381.25 11.17
DABUR 100 104.35 99.5 103.65 9.98


Top Losers
Symbol Open High Low Close % Change in OI
TTML 32.95 34.6 32.6 34.3 -14.41
NAGARFERT 43.7 44.55 43 43.8 -12.28
ARVINDMILL 52.2 54.25 52 52.65 -11.27
TITAN 1424.65 1435 1385.6 1403 -10.27
DENABANK 67.8 68.35 65 65.65 -10.22
CORPBANK 338.4 345 337.35 341.75 -9.56
TATACHEM 251.8 262.8 250.85 261.8 -8.15
BEML 1205 1244.9 1205 1232.75 -7.09
........................... Click here to read more!

Tuesday, 11 September 2007

Following is a list of top gainers and losers in the futures and options market in the NSE on the 10 Sep 2007 for the September series:

Top Gainers
Symbol Open High Low Close % Change in OI
CAIRN 151.9 159.2 151.5 158.4 80.39
UNIPHOS 329.5 347 329.5 341.55 47.39
ROLTA 510 522 501 506 44.29
MCDOWELL-N 1525.5 1608.95 1510 1590.5 40.28
NIITTECH 369.6 374.8 359 363.3 39.35
BHUSANSTL 909 951.9 893 931.25 39.24
TULIP 870 927 870 915.4 31.81
BIOCON 465 478.4 463 474.8 31.37
WELGUJ 233 238.95 230.35 232.9 29.22
TVSMOTOR 65.05 74.9 64.1 73.3 29.17
EDUCOMP 2831.25 2988.9 2831.25 2933.8 25.53
ESCORTS 101 110.2 101 109.6 23.61
APTECHT 372.8 387.9 370 383.55 23.6
JSWSTEEL 690 702.7 679.05 681.65 23.12


Top Losers
Symbol Open High Low Close % Change in OI
BONGAIREFN 56.5 60.25 56.2 59.95 -25.76
NAGARFERT 42.05 43.75 42.05 43.2 -10.82
CHENNPETRO 270 286.25 269.15 285.55 -7.61
IOC 390 406.9 390 405.3 -7.37
INDIANB 149.25 155.5 149.25 154.2 -7.2
IFCI 69.2 75 69.2 74.7 -6.78
NAGARCONST 210 216 210 214.6 -5.45
AMBUJACEM 137.05 143.75 137.05 143.15 -5.12
........................... Click here to read more!

Disclaimer : Recommendations or suggestions given here are totally free. Care has been taken to give correct advice / information / recommendations / suggestions /tips. We take no guarantee that the mentioned analysis will work to your benefit. Since we are involved in the market, we take pleasure in giving the best for the benifit of all. We have interest in the market and may or may not have positions in some or all of the stocks that are mentioned. We do not have any clients as such. These views are purely personal. We do not take any responsibility in any profits or losses that any one incurs as a result of these views / suggestions / recommendations / advice / tip /etc. Please do your own due diligence before initiating any trades as a result of this information.

Followers