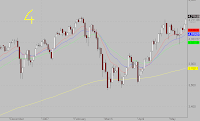
In case 1, in May 2004, the market had in fact hit a low which was way way below the 200 dma, which happend very fast and took 3 months to recover and come over that line as the 200 day average had flattened out.
Case 2 is April 2005, where the 200 day line was just kissed twice within a span of 10 days without the market diving too deep. The fall was also gradual and the total time spend under the line was 2 weeks.
Case 3 is May 2006 where the markets had tanked suddenly and after the first touch of the 200 day line had bounced back only to go down slowly once again under the 200 day line remaining there for a complete month of June. After that a little recovery occured and a higher top was made and then again went down for only a week below the average line. This time the lows made were far far higher than the lows made when the fall was at its maximum.
Th 4th Case is of May 2007. Here a solid support level was created when markets tanked to pierce the 200 day line on 3 occasions with in a quick span of 10 to 15 days and the support level was created with a difference of 62 points from one another.
The 5th Case is the current one when on Friday, the markets dipped to pierce the 200 day line only to close way above the line. This shows some solid support for the 200 dma line whence buying automatically came back to pull the market. It may be interesting to note that in this fifth case, the market has dipped rather too early and well before expected correction time. The time factor plays a great havoc when marktets right now are in the middle of two quarterly result season and not much can be done to control the movement with the genuine companies results and growth.
The wave counters might seem to explaing that for the current fall, we have seen first down and second up and third down which finished on friday. Today a fourth corrective up will be there as all markets around the world are roaring. And this should take the markets up for some time before the final finale. Will this finale lead to make a new low ? This is difficult point to gauge. In all likelihood, the markets may go down deeper as the global stock market scene is not all that good. Yen is moving too fast as compared to the Dollar. This shall have to be curtailed with a change in the rates sooner or later. The meet is next week. Sub prime problem has been blown out of proportions. The problem has been there in the USA since quite a long time but now staticstics have come out to show that things are real bad. Is it real or just hyped has to be seen. The central banks are of course helping the banks there as well as all other parts of the world to stabilize positions.
We in India have a new problem of coalation government not moving together.
Coming back to the 200 dma line, the market remaining below the line has ranged between 10 days to 3 months. This one shall again test the line or pierce it to go down. Minimum time expected to be in the grip of the 200 dma is say one week. Maximum time can be estimated to be four to five weeks. How deep can the market go in these days ? That is anybody's guess. For we still have some time to move up and then go down again. After some bottom has been formed, expect some side ways movement or another small wave down before the final bottom is formed or a retest of the previous bottom is done.
For Emergency BLOOD requirement in any city in India, SMS to 5676775
"Blood< s p a c e > PIN code of your city < s p a c e > required blood group < s p a c e > your name"
"Blood
Friday, 17 August 2007
What happens when nifty touches the 200 dma ?
Subscribe to:
Post Comments (Atom)
Disclaimer : Recommendations or suggestions given here are totally free. Care has been taken to give correct advice / information / recommendations / suggestions /tips. We take no guarantee that the mentioned analysis will work to your benefit. Since we are involved in the market, we take pleasure in giving the best for the benifit of all. We have interest in the market and may or may not have positions in some or all of the stocks that are mentioned. We do not have any clients as such. These views are purely personal. We do not take any responsibility in any profits or losses that any one incurs as a result of these views / suggestions / recommendations / advice / tip /etc. Please do your own due diligence before initiating any trades as a result of this information.


No comments:
Post a Comment