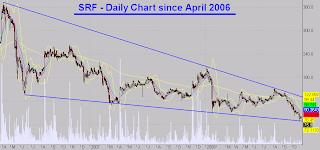
 SRF Limited chart has been moving in a massive falling wedge since April 2006 and has recently formed a bottom of 66.5 on the 27th October 2008. One point worth nothing to have put this information across is the way the price has been oscillating between the two wedge lines. What can be the next move with the overall stock market having done a low of 225x on the nifty? Nifty has smartly recovered after that and looks like this stock should do some minor rise. The next bounce can be roughly assumed to be the top line of the wedge. If we happen to look at the climate exchange charts shown above, we see that a rough double bottom was attempted at 680 levels (the last bottom was almost an year back from where it had bounced hard). On a smaller time frame a quick double bottom was made within a span of the last 20 trading days. Assuming that this could be a intermediate bottom in the short to medium term, we can expect these values to start moving upwards. Current CLE value is up from 680 a few days ago to 970 (intra day 1000 peak has been reached). It has to be seen that a move here now can even be considered to be a dead cat bounce. SRF may or may not do a blast but if CLE values keep appreciating, so can the value of the stock for some time. The wedge on SRF is ideally ripe enough to break. The break can be on downside as well as up. Assuming that CLE values are rising and fundamentally the SRF is doing alright, we can expect the price to at least move up to the top edge of the wedge. A rough target of 100-110 can be reached in the next 2 months. Please do your own due diligence taking fundamental factors into consideration.
........................... Click here to read more!
"Blood
Friday, 31 October 2008
What is SRF doing ?
Thursday, 30 October 2008
Wednesday, 29 October 2008
Unitech - what next in the very near future

........................... Click here to read more!
Sunday, 26 October 2008
Nifty 2610 target done !
Refer to our earlier post Is Nifty that bad ? - 2610 coming ? . Did we expect that to happen ? Well frankly speaking no. That was just a target technically seen as the formation warrented that ! A massive head and shoulder formation was an indication of something bad.
........................... Click here to read more!
Monday, 13 October 2008
What can Nifty do in the very near future

........................... Click here to read more!
FnO
Following is a list of top gainers and losers in the futures and options market in the NSE on the 10th October 2008 for the October series: Top Gainers % CHANGE SYMBOL OPEN HIGH LOW CLOSE OPEN_INT CHG_IN_OI IN O.I. JINDALSAW 389.95 394.7 355 359.1 359000 152750 74.06 INDIAINFO 65.1 70 55.2 58.2 1782500 465000 35.29 AXISBANK 602 644 540.7 554.55 1767600 436950 32.84 KOTAKBANK 409 455 390 439.6 2401300 550275 29.73 UNIONBANK 142 150.65 137 147.3 3061800 665700 27.78 EKC 210 219.65 196.2 205.2 122000 21000 20.79 PNB 476.1 503.5 462.5 464.8 4948200 671400 15.7 HDFC 1780 1852 1641.1 1726.3 1548225 188850 13.89 PUNJLLOYD 211.3 221.35 189.15 194.9 6714750 777000 13.09 RCOM 278 283.75 230 238.7 17163300 1801450 11.73 COREPROTEC 233 244.85 123 144.4 6193500 629250 11.31 HINDALCO 82.25 90.45 77 79 33542371 3345618 11.08 NAGARCONST 63.8 65.6 53 54.35 2146000 174000 8.82 CIPLA 205 205 191.4 195.7 2712500 216250 8.66 GNFC 61.1 67 57.2 60.1 969075 76700 8.6 ICICIBANK 420.25 423 328 365.75 12572525 985250 8.5 BRFL 213 243.9 207 238.55 1681300 126500 8.14 CUMMINSIND 250.3 253.65 248.05 251.25 57000 4275 8.11 BHEL 1371.35 1409.5 1291.5 1346.45 2290650 162450 7.63 HINDPETRO 199 212 190 198.4 2971800 209300 7.58 DLF 285 307.9 281.25 284.65 11958000 790800 7.08 BANKINDIA 256 275.5 249 262.85 1693850 108300 6.83 HDFCBANK 1040 1088 980 1049.45 1663800 101200 6.48 AMBUJACEM 69.75 77 63.5 64.7 6060218 350540 6.14 YESBANK 78 86.65 69 72.35 1397000 80300 6.1 RPOWER 128.1 128.1 116.2 121.8 14271000 800000 5.94 HINDUNILVR 230 234.6 219.1 223.7 9505000 524000 5.83 SESAGOA 87.85 90.65 78 89.05 10116000 556500 5.82 TATASTEEL 315 318 282.6 289.85 11548624 622278 5.7 NIITLTD 29.7 32.5 27.5 28.5 1117950 59450 5.62 ONGC 919.95 970.95 900 923.5 5855175 281925 5.06 Top Losers % CHANGE SYMBOL OPEN HIGH LOW CLOSE OPEN_INT CHG_IN_OI IN O.I. MONNETISPA 217 217 210 210 13050 -4500 -25.64 VOLTAS 61 71.05 61 64.9 1834200 -522000 -22.15 BATAINDIA 91 94.8 84.5 85.55 341250 -93450 -21.5 JSWSTEEL 252 309 240 298.45 918775 -246400 -21.15 ROLTA 141.1 156 135 146.6 812700 -201600 -19.88 ABAN 962.15 1156.95 878 1112.45 384950 -91900 -19.27 IRB 90 95.55 90 94.4 46200 -9900 -17.65 GTOFFSHORE 251.1 285 242.05 277.4 195500 -41250 -17.42 DIVISLAB 1030 1110 972 1068.5 286130 -57505 -16.73 J&KBANK 400 418.9 400 418.9 3000 -600 -16.67 BAJAJHIND 70 71.55 58 59.7 5822550 -1080150 -15.65 UCOBANK 25 30.2 25 28.95 2410000 -430000 -15.14 MPHASIS 149 149 119.55 131.8 1287200 -216800 -14.41 EVERONN 253 258 227 227.25 42800 -7200 -14.4 KFA 38.55 42.55 35 38.55 1482400 -233750 -13.62 SOBHA 105 125 102.55 121.3 377650 -57400 -13.19 ZEEL 160 176 152 164.45 2076200 -308000 -12.92 CANBK 150.25 176.85 142.6 173.85 746400 -108000 -12.64 MOSERBAER 90.1 98.5 90.1 95.95 2172225 -290400 -11.79 SATYAMCOMP 237 261 222 252 4303200 -573600 -11.76 RELCAPITAL 870 870 771.1 789.55 2735712 -364320 -11.75 CROMPGREAV 185 199 181 183.95 189000 -23000 -10.85 NAGARFERT 19 19.1 17.3 17.7 9275000 -1120000 -10.77 RECLTD 62.1 71.35 62 65.35 1131000 -128700 -10.22
........................... Click here to read more!
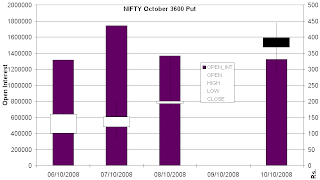
Open Interest Charts - Nifty October Puts/Calls - 10 October 2008
........................... Click here to read more!
Tuesday, 7 October 2008
Volatility Index CBOE Shooting


........................... Click here to read more!
Dow royally bashed
........................... Click here to read more!
Saturday, 4 October 2008
Is India walking into a Financial Mess ?
 ----- source - marc faber
........................... Click here to read more!
Wednesday, 1 October 2008
Nifty - what next ?

Post the Dow Jones trading time we get to see that the American markets almost hit a 500. Does this add to our sentiments ? To some extent yes, as the last few days nifty here has been going not in perfect sync with the American market. But in all likelihood, our markets should go gung-ho and at some time should see some profit taking later or in the end to culminate with a trading holiday on the 2nd.
........................... Click here to read more!


